106年:核醫診療(1)
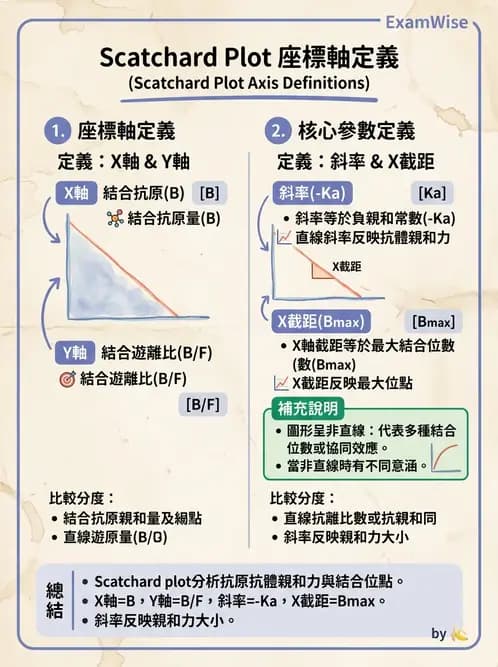
競爭結合型放射免疫分析( RIA )中,Scatchard plot 之X軸與 Y軸分別為:
AX 軸為 bound-to-free ratio (B/F ), Y 軸為 bound antigen 濃度
BX 軸為 bound antigen 濃度 , Y 軸為 bound-to-free ratio (B/F )
CX 軸為 free labeled antigen (F) 值, Y 軸為 bound antigen (B) 值
DX 軸為 bound antigen (B) 值, Y 軸為 free labeled antigen (F) 值
詳細解析
本題觀念:
本題考查競爭結合型放射免疫分析(radioimmunoassay, RIA)中,Scatchard plot 的座標軸定義。Scatchard plot 是分析抗體(或受體)與抗原(配體)結合親和力及結合位數目的重要圖形工具,由 George Scatchard 於 1949 年提出。
選項分析
(A) X 軸為 bound-to-free ratio(B/F),Y 軸為 bound antigen 濃度 X 軸與 Y 軸顛倒,此描述錯誤。
(B) X 軸為 bound antigen 濃度,Y 軸為 bound-to-free ratio(B/F) 此為標準 Scatchard plot 定義:
- X 軸:bound antigen(B)的濃度(即與抗體結合的抗原量)
- Y 軸:bound-to-free ratio(B/F),即結合型抗原與游離型抗原的比值
(C) X 軸為 free labeled antigen(F)值,Y 軸為 bound antigen(B)值 此描述為 B vs. F 圖(簡單結合曲線),非標準 Scatchard plot。
(D) X 軸為 bound antigen(B)值,Y 軸為 free labeled antigen(F)值 此同樣不是標準 Scatc
...(解析預覽)...
升級 VIP 解鎖圖文解析